What are home prices doing?
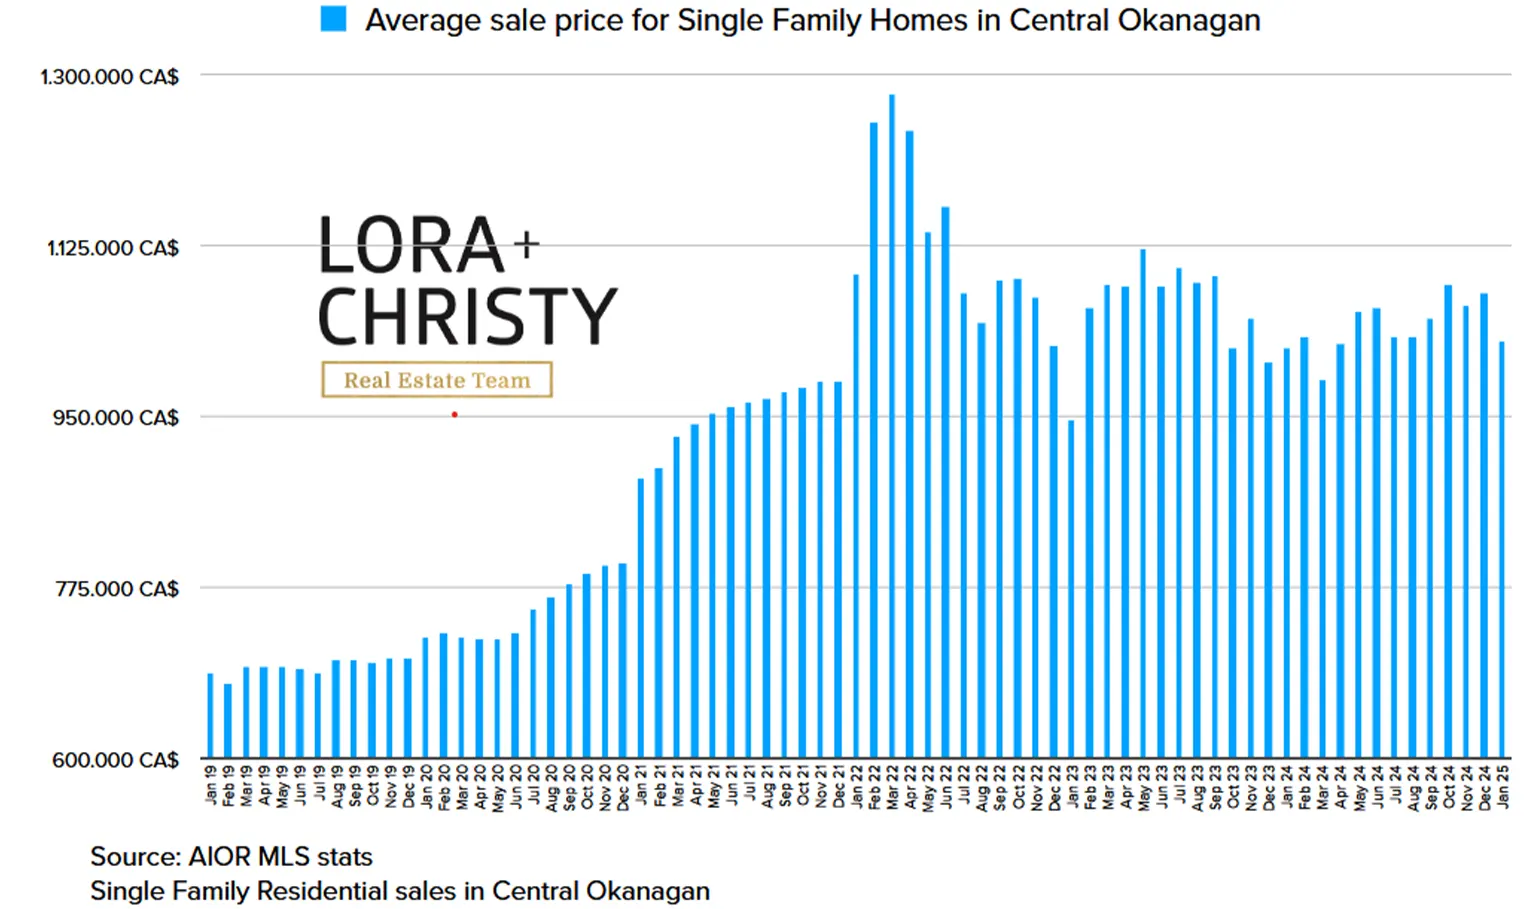
This page provides historical MLS average price trends for Kelowna. It is based on single family residential sales in the Central Okanagan from data provided by the Association of Interior Realtors (AIOR)
See also: Kelowna Neighbourhood Pricing
MLS Average Price Trend since Jan 2019

This graph showcases the real estate market cycle for the past 5 years - something we often get asked to share and comment on. In 2018, the market was stable and predictive; rising in the spring, peaking during the summer through to the fall, then dipping down towards the winter months. 2019 was stable again leading up to 2020 when our local market began its ascent into a booming seller's market with prices rising to record levels until it’s peaking in March 2022. 2022 saw a downward trend as interest rates rose which continued through to early 2023.
*Data collected from MLS® sales via Association of Interior Realtors®. Stats include sales of Single Family Homes not including waterfront sales in Central Okanagan.
Having trouble viewing the graph?
Explore Neighbourhoods
Kelowna Neighbourhoods:
Alphabetical
West Kelowna Neighbourhoods:
Other Neighbourhoods:
